Automotive Predictive Maintenance
A course project that took messy automotive sensor data from preprocessing and model comparison to a working maintenance app.
Ardalan Aryashad, Sean Richard, Jian Ni, Junyi Wang
AME 505: Engineering Information Modeling · Fall 2023 · USC
Abstract
What if your car could warn you before something goes wrong? In this project, we used real car sensor data and machine learning to predict engine problems early. We cleaned messy data, tested different models, and built a simple mobile app that gives drivers clear and helpful alerts about their car’s health.
Designing the Object Model
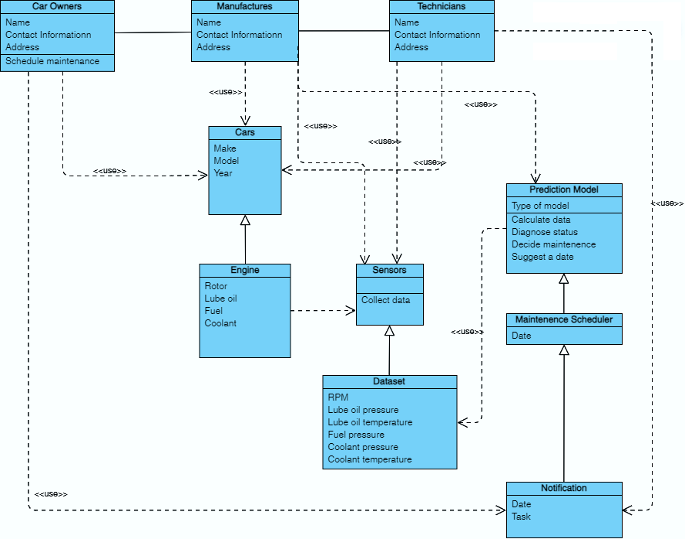
Every robust system starts with thoughtful design. In our project, that design took the form of an object-oriented model that mirrors how data flows in real vehicles. Before diving into machine learning, we focused on building a structured pipeline that could handle inputs, make predictions, and respond to user feedback.
We designed our object model around several core classes: Engine, Car, Sensor, and Predictor. The Sensor class was responsible for reading key engine parameters such as RPM, coolant temperature and pressure, oil temperature and pressure, and fuel pressure. These readings served as the input for our prediction system.
The Predictor class held the trained machine learning model. It accepted input from the sensors (in the form of VehicleData instances from the Dataset), handled internal pre-processing, and returned a health prediction. This modular approach ensured that updating the pre-processing method or swapping the model would not break the rest of the system.
We also modeled interactions with the car owner. A maintenance scheduler monitored prediction results and sent notifications to the user. It allowed users to accept or reject suggested maintenance times and updated the app interface based on their choices.
Dirty Data: Preprocessing for Prediction
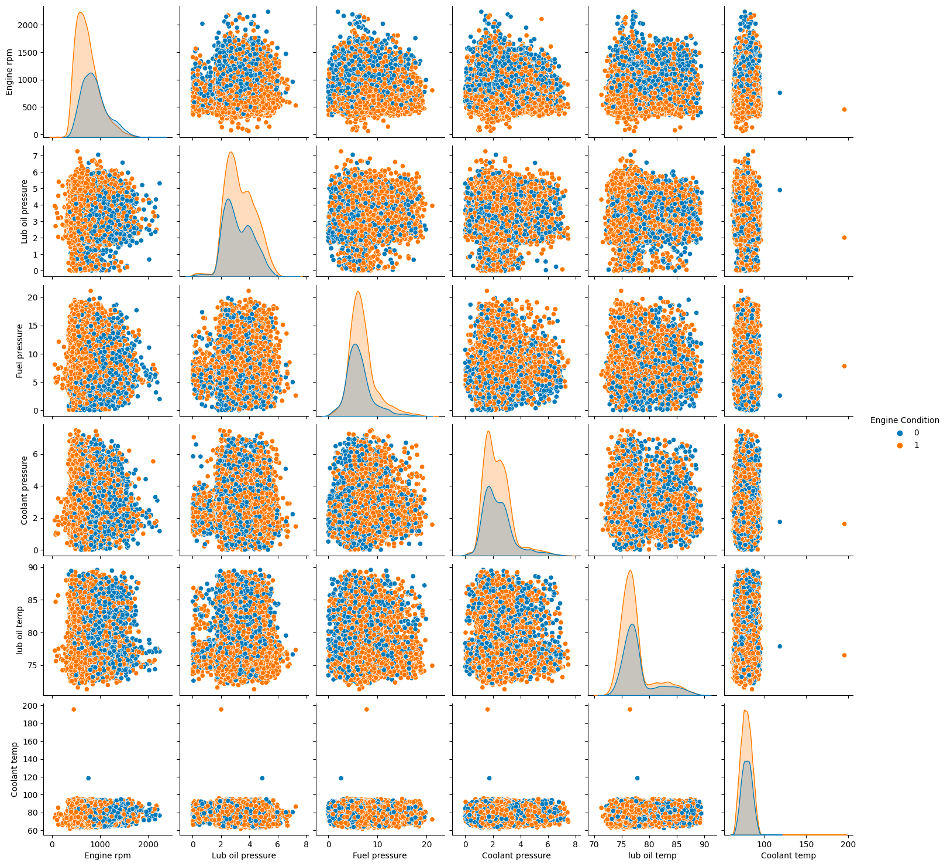
Real-world data is rarely clean, and our automotive dataset was no exception. With over 19,000 engine samples, we encountered the usual suspects: outliers, skewed distributions, and uneven scales.
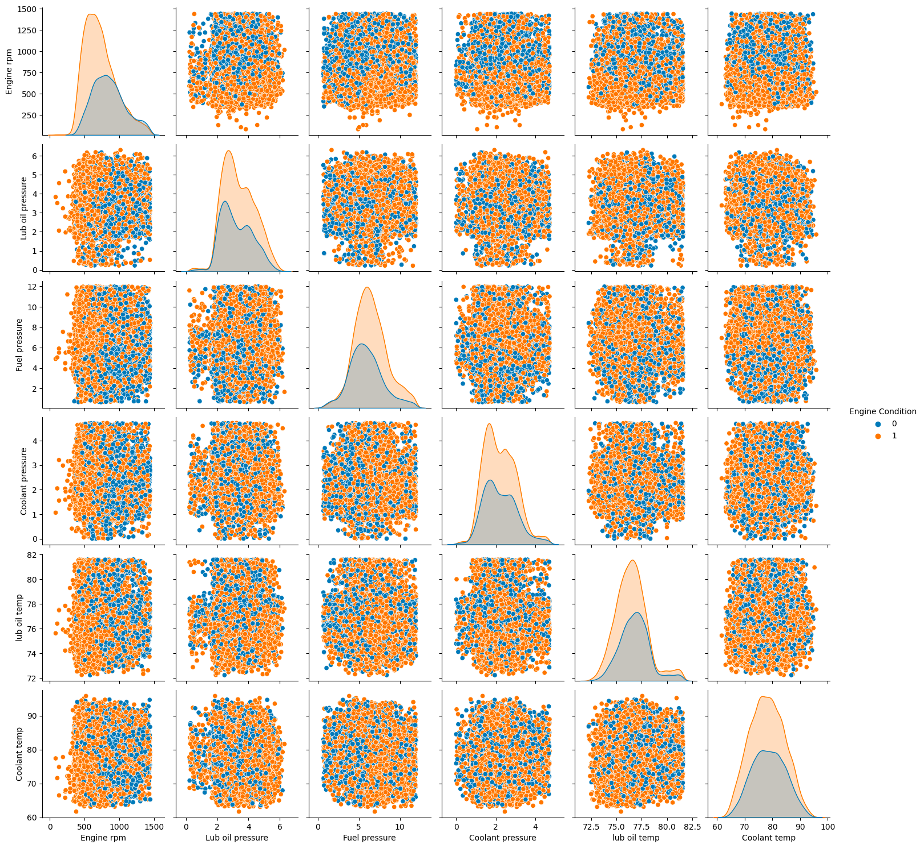
We began with outlier analysis using the Interquartile Range (IQR) method. For each feature (RPM, coolant temperature, etc.) we computed the 25th (Q1) and 75th (Q3) percentiles. Values falling below Q1 − 1.5×IQR or above Q3 + 1.5×IQR were flagged as outliers and removed.
After cleaning, we faced feature scale imbalance — RPM spans thousands of units while coolant temperature stays in a much smaller range. To give each feature equal weight, we applied MinMax scaling (scikit-learn’s MinMaxScaler), transforming all features to a 0–1 range.
Machine Learning Methods: Finding the Right Fit
With clean data in hand, we tested six different classifiers, each with distinct strengths and weaknesses:
- Logistic Regression — fast, interpretable baseline; 66.74% train / 65.91% test.
- Decision Tree — learned nonlinear patterns; 68.95% train / 64.59% test (mild overfitting).
- Random Forest — ensemble of trees; highest training accuracy (79.33%) but modest test gain (65.64%).
- k-Nearest Neighbors — intuitive but overfit heavily; 75.28% train / 62.21% test.
- Gaussian Naive Bayes — best generalizer despite independence assumption; 67.09% train / 66.11% test.
- Support Vector Machine — struggled with hyperparameter sensitivity; 64.88% train / 60.77% test.
| Model | Training Accuracy | Testing Accuracy |
|---|---|---|
| Logistic Regression | 66.74% | 65.91% |
| Decision Tree Classifier | 68.95% | 64.59% |
| Random Forest Classifier | 79.33% | 65.64% |
| K-Neighbors Classifier | 75.28% | 62.21% |
| Gaussian Naive Bayes | 67.09% | 66.11% |
| Support Vector Machine | 64.88% | 60.77% |
Table 1: Training and testing accuracy of each machine learning model.
Our top performer (Gaussian Naive Bayes, 66.11% test accuracy) showed that the dataset itself was a limiting factor — many “healthy” and “faulty” samples had overlapping sensor profiles. Sequential models like LSTMs might improve performance in future work by modeling temporal trends rather than snapshots.
A Mobile-Friendly Dashboard
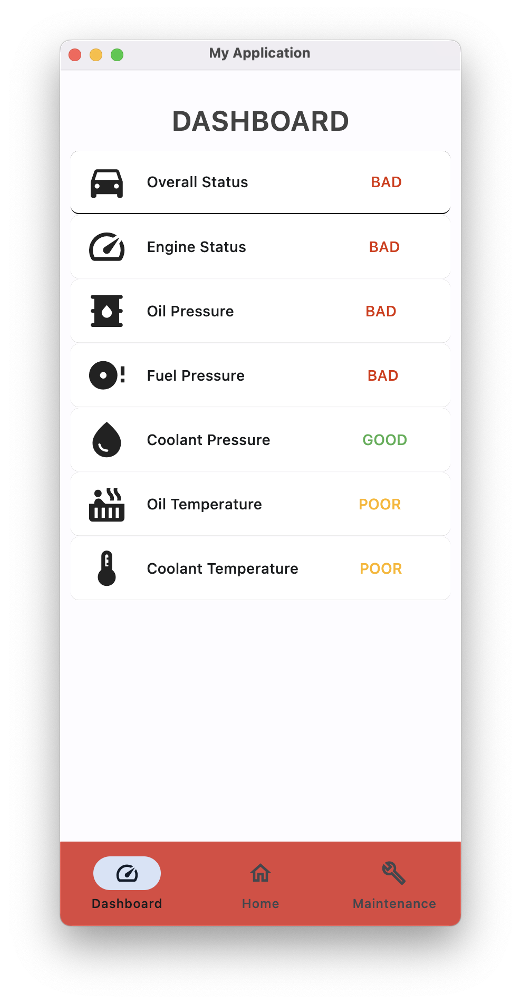
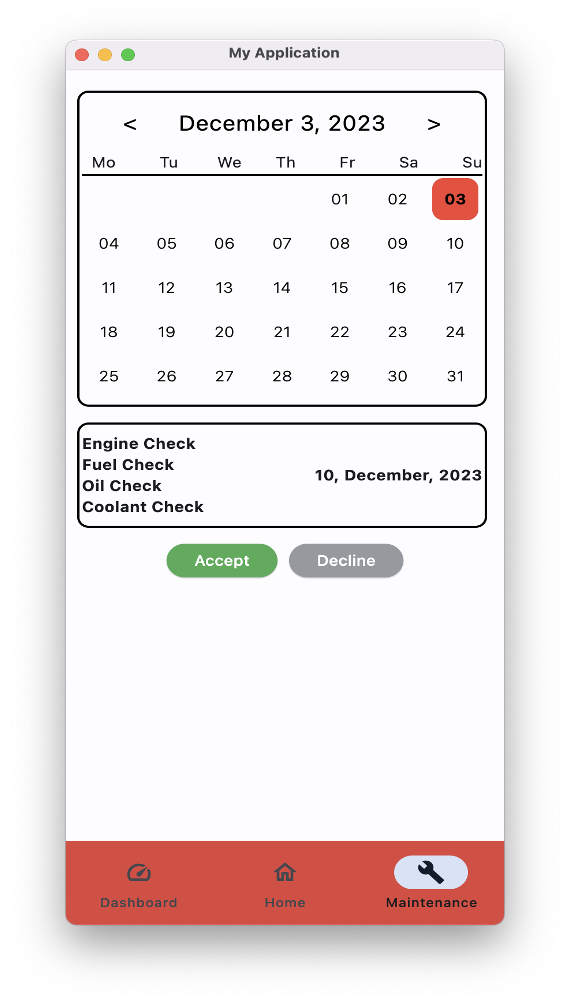
After building the prediction model, we created a user interface using Flet — a Python framework that produces cross-platform apps for Android, iOS, and desktop from a single codebase. Car owners need quick, clear answers, not raw sensor logs. Our app delivers that with three screens:
Home Page — enter six engine values (RPM, coolant temp/pressure, oil temp/pressure, fuel pressure), or hit “Randomize” to test different inputs.
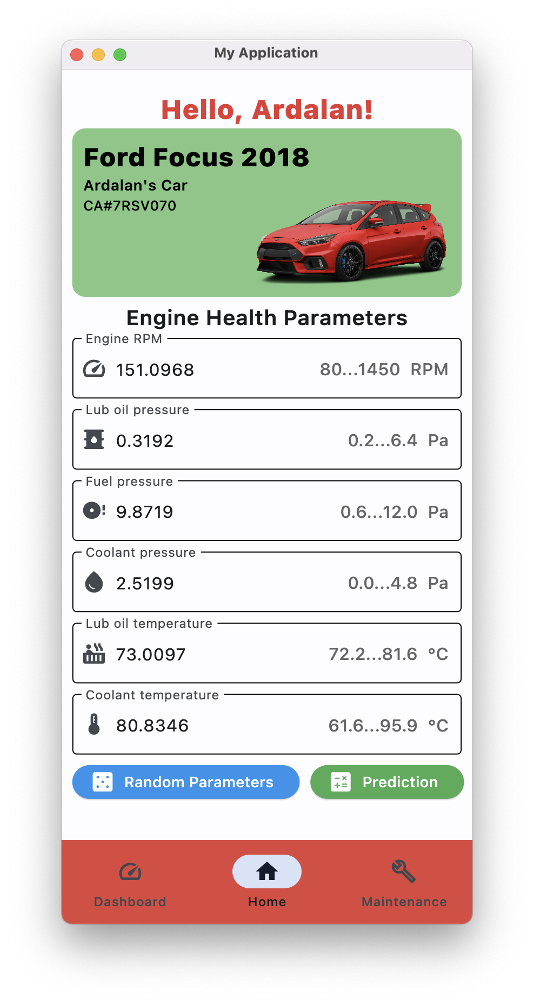
Dashboard Page — shows the prediction: Good, Poor, or Bad with clear color labels.
Maintenance Page — a calendar that suggests inspection dates. Users accept or reject suggestions; accepted dates turn green for easy tracking.
Demo
Figure 7: Full app demo.